
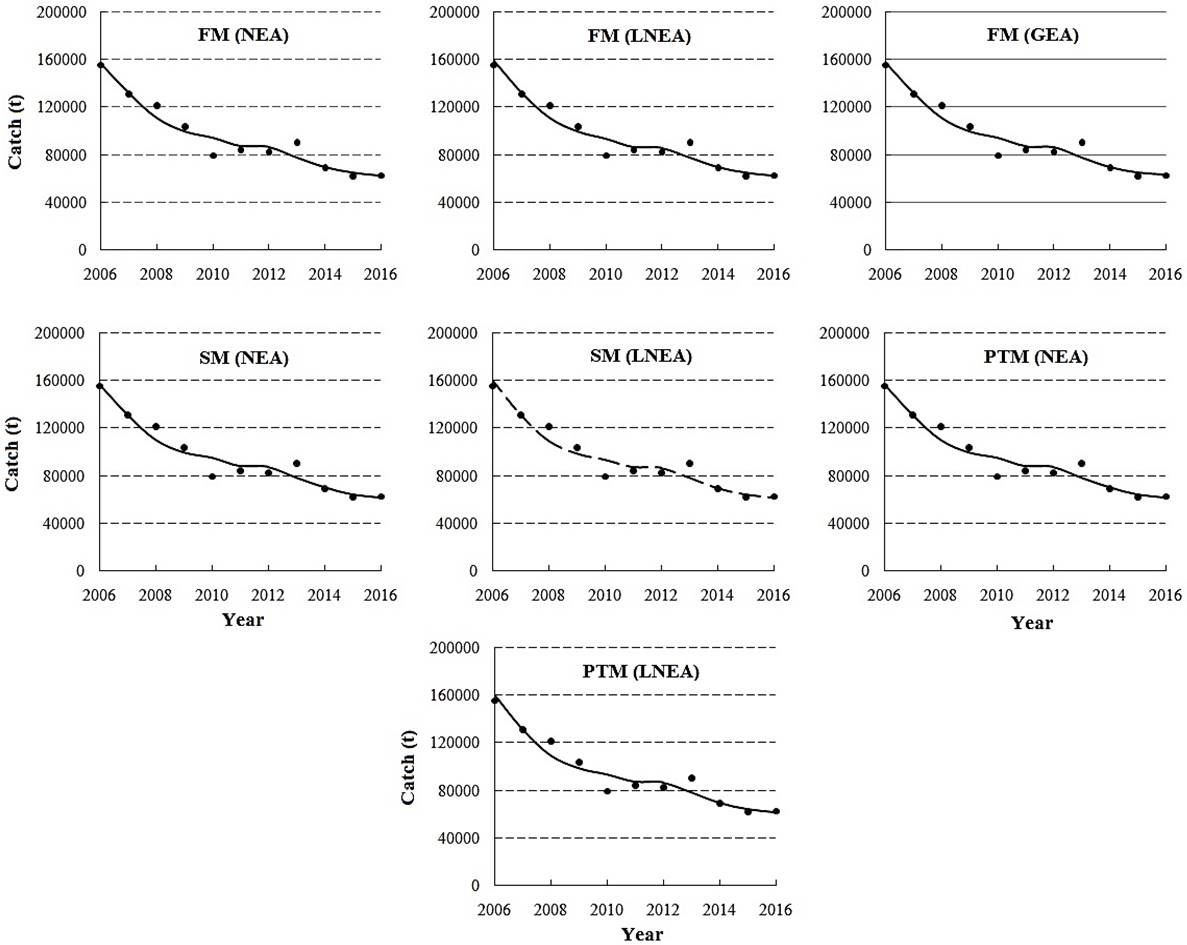
Fig. 3.
CEDA graphs obtained for IP 1. Dots represent observed catch (t) whereas straight line indicates expected catch (t).
CEDA graphs obtained for IP 1. Dots represent observed catch (t) whereas straight line indicates expected catch (t).